


introductory
existmobile applicationWith competition heating up, over 60% developers are still caught in a key cognitive misconception: equating keyword ranking improvement with success all together. Data shows that the average click-through rate for keywords that rank in the top 3 can be up to 35%, but nearly 40% of that traffic can be lost within 24 hours. We put a lot of effort into optimizing our keywords and rejoice when we see a rise in rankings.
A more essential question has been ignored: who are these users who come through search and only 28% will complete the core in-app operations? Do they bring real value to the product? This article is designed to break the limitations of the only ranking theory, guide the establishment of traffic quality as the core of the evaluation system, a real insight into keyword optimization to bring the effectiveness of the business.

Part I: Beyond Ranking: Establishing Quantitative Criteria for Keyword Performance
Keyword rankings are a starting point, not an end point. We need a finer set of metrics to quantify the true impact of rankings.
1.1 Accurate capture of core ranking data
Simply recording the ranking of a keyword at a specific time is one-sided. Meaningful ranking monitoring should incorporate the following dimensions:
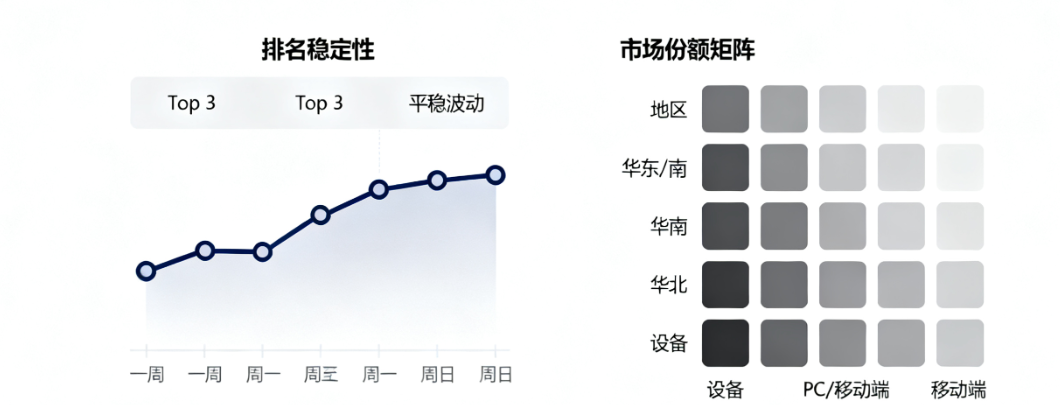
- Ranking Stability: A keyword that stays in the Top 3 for a week is far more valuable than if it shoots to #1 one day and then slips quickly. You need to watch how it fluctuates over time.
- Market Share View: Record differences in keyword rankings by region and device model. This helps to locate potential market opportunities or identify localization issues.
1.2 Correlation analysis between ranking and exposure
Rankings don't produce value in and of themselves, their value is in the exposure they bring.
- Estimated natural exposure: Estimate the average daily exposure that a specific ranking position will receive using data provided by a third-party tool or platform. There is an exponential difference in the magnitude of exposure between rank #1 and rank #5.
- Analyze exposure shares: What percentage of the total exposure to your target keyword set does your app account for? This metric provides a macro view of your overall search visibility.

1.3 Conversion effectiveness from exposure to clicks
Click-through rate is a litmus test of how well a keyword list matches a user's search intent.
- Calculate the click-through rate: CTR = Clicks / Exposures. A high ranking but low CTR keyword indicates that its metadata (title, subtitle, icon, screenshot) is unattractive to the user, or that the keyword deviates from the actual functionality of your app.
- Optimize trigger points: A low CTR directly specifies the need forA/B testingThe direction of optimization is whether to change the title to highlight the core value or to replace the screenshot to better showcase the content.

Part II: Insight into the essence: designing a multi-dimensional traffic quality assessment system
When traffic starts pouring in, assessing its quality becomes a core task. High-quality traffic is a user base that is a high fit with the product and translates into long-term value.
2.1 User Precision Dimension
Whether the traffic is accurate or not directly determines the efficiency of the subsequent conversion.
- Keyword Intent Match: A distinction will be made between users brought by brand terms, competitor terms, industry generic terms, and long-tail demand terms. Brand word users have clear intentions and high conversion rates; while long-tail demand word users may be in the information gathering stage and need a longer conversion path.
- Target user profile overlap: Analyze whether the natural attributes (e.g., geography, device, language) of users who flow in through different keyword clusters are consistent with your product's target user profile.
2.2 User Engagement Dimension
The user's behavior after downloading is a direct reflection of the quality of the traffic.

- Next Day/7 Day/30 Day Retention: This is a measure ofuser adhesionand golden indicator of product attractiveness. High-quality traffic brings users who are more likely to use your app repeatedly.
- Average session length vs. startup frequency: How long do users stay with the app each time they open it? How many times per day do they open it? This behavioral data depicts the depth of user engagement.
- Core functionality access depth: Has the user completed the key actions that the product wants him to complete? For example, completing the first browse in the shopping app, reading more than three articles in the content app, and completing the core tools in the tools app.
2.3 Business value dimensions
Ultimately, all traffic needs to serve business goals.

- Conversion rate: Define core conversion events and calculate their conversion rates based on different app types. For example: signup rate, subscription rate, purchase rate, content completion rate, etc.
- User Lifecycle Value Prediction: For apps with in-app purchases or subscription models, an initial projection of the potential long-term value of users sourced from different keyword channels. This provides top-level guidance for optimizing budget allocation.
Part III: Measuring Returns: Building an ROI Calculation Model for Keyword Optimization
Inputs must be rewarded. A clearROIThe calculation model that is the ultimate basis for convincing the team to keep investing in keyword optimization.
3.1 Cost-accounting framework
Define the full costs involved in the optimization effort.
- Direct labor costs: The cost of time invested by optimizers, product managers, designers, and developers.
- Tool procurement costs: Annual fee for purchasing ASO data analysis tools, A/B testing platforms, etc.
- Indirect collaboration costs: Overhead from cross-departmental communication, project management.
3.2 Attribution and Quantification of Benefits
Reasonably attribute business growth to keyword optimization efforts.
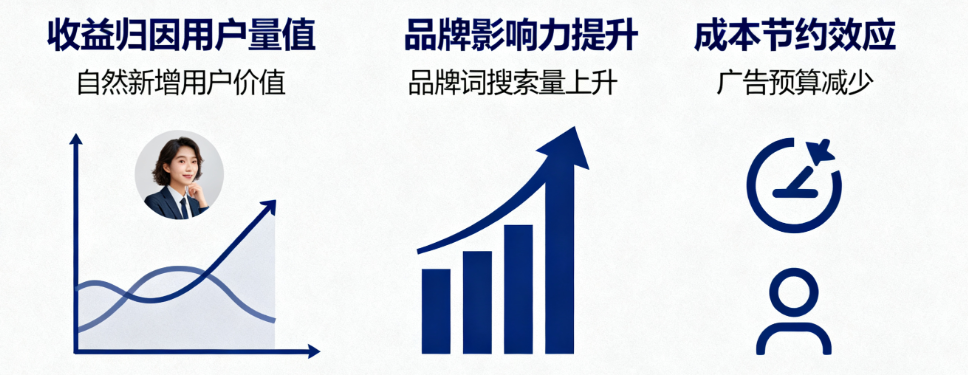
- Natural new user value: Calculate the number of additional natural new users due to keyword optimization and multiply it by the average value of each natural user (which can be discounted based on the market's cost of acquiring a paid user).
- Brand influence is enhanced: Growth in searches for brand terms can be used as indirect evidence of increased brand influence, which is difficult to monetize directly but is strategically important.
- Cost-saving effect: By acquiring more high-quality natural users, there is relatively less pressure on the budget in terms of paid advertising, which equates to savings in user acquisition costs.
3.3 ROI Calculation and Iterative Optimization
Synthesize the costs and benefits to arrive at a final ROI.

- Basic ROI formula: ROI = (Revenue - Cost) / Cost * 100%.
- Establishment of a dynamic monitoring dashboard: Consolidate all of the above metrics into one data Kanban board and review it regularly. Focus not only on the overall ROI, but also drill down to analyze the ROI of different keyword categories and optimization projects to guide future optimization resource allocation.
- Forming an optimization closure: The results of the ROI model should feed directly into the optimization strategy. Invest more in high ROI keyword types and analyze the reasons for low ROI areas and adjust or abandon them.
reach a verdict
Keyword optimization has transcended the simple ranking competition and evolved into a race to accurately capture and evaluate the value of high-quality traffic. The establishment of a complete system covering ranking quantification, traffic quality assessment and ROI calculation can help developers penetrate the fog of data and truly understand the user meaning and commercial value behind every ranking change.

Link to this article:https://www.361sale.com/en/80186/The article is copyrighted and must be reproduced with attribution.


![表情[wozuimei]-光子波动网 | WordPress教程、Elementor教程与故障修复](https://www.361sale.com/wp-content/themes/zibll/img/smilies/wozuimei.gif)
![表情[baoquan]-光子波动网 | WordPress教程、Elementor教程与故障修复](https://www.361sale.com/wp-content/themes/zibll/img/smilies/baoquan.gif)


No comments