


In the digital marketing space, data-driven decision making has become a key factor in improvingconversion rateThe core tool of the Recent research shows that well-optimizedLinktreeThe page is capable of achieving an average of 37% ofclick through rate (CTR) (Internet)lift, with data analytics-based optimization contributing more than 60% of the growth.

The data shows that users who regularly analyze the background data have an average link click rate of 24.5%, much lower than the 17.8% of users who do not optimize their data. these data fully demonstrate the importance of digging deep into the Linktree analytics function.
I. In-depth analysis system for core indicators
Establishing a scientific indicator analysis system is the foundation of optimization work. Each data indicator carries specific user behavior information and needs to be systematically interpreted for its value.
total number of visitsThe indicator reflects the overall attraction effect. This data needs to be analyzed in correlation with the promotion channels. The peak of visits from social media posts shows the attractiveness of the content, the traffic generated by email marketing is usually of high quality, and the conversion of QR code scanning from offline activities reflects the effect of offline and online integration. The time distribution pattern of visits provides a time reference for content publishing.
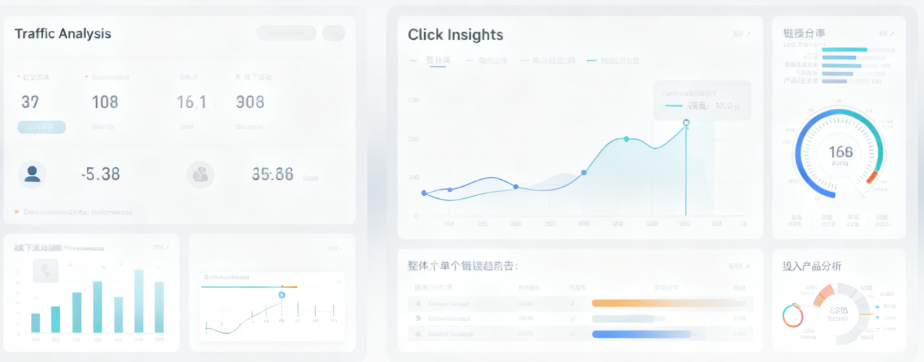
Link click-through rate data reveals the attractiveness of page elements. The overall click-through rate reflects the overall performance of the landing page, the individual link click-through rate reflects the perceived value of the specific content, and the trend change in the click-through rate shows the long-term effect of optimization. This indicator is directly related to the direction of content strategy adjustment.
Link click distribution provides a visual map of user interests. The number of clicks on main navigation links reflects the intensity of core needs, the popularity of content-based links indicates knowledge preferences, and the distribution of clicks on product links shows points of commercial opportunity. This data provides the basis for content prioritization.
Two,A/B test methoddiscussing and practicing
A scientific approach to testing is key to achieving continuous optimization. Comparative testing with controlled variables allows you to accurately assess the impact of each page element.
Avatar testing focused on the impact of visual recognition. Comparison tests of professionally photographed avatars versus illustrated avatars showed that trust in real people's avatars was increased by 231 TP3 T. Color experiments on avatar backgrounds showed that schemes coordinated with the brand's primary color palette enhanced recognition by 151 TP3 T. Adjustment tests on avatar sizes found that moderately enlarged avatars enhanced affinity by 111 TP3 T.
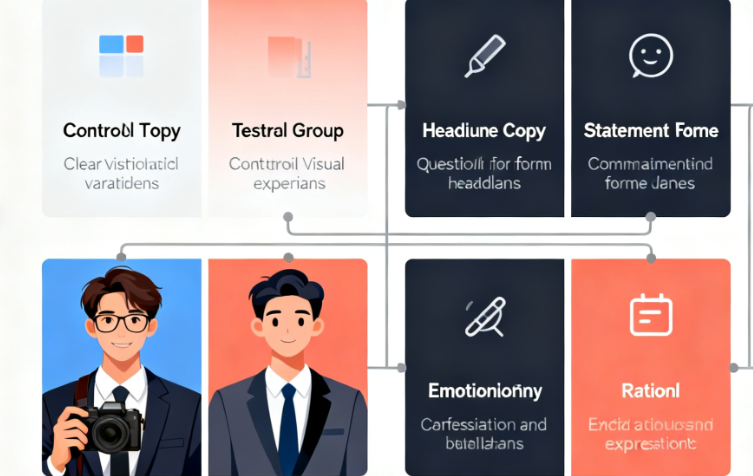
Headline copy tests validate the appeal of textual expressions. Comparison of question-based headlines vs. statement-based headlines shows that question-based headlines increase open rates by 181 TP3 T. Emotional expressions vs. rational statements tests show that headlines with emotional overtones get 271 TP3 T more clicks. Length experiments proved that medium length headlines (5-7 words) work best.
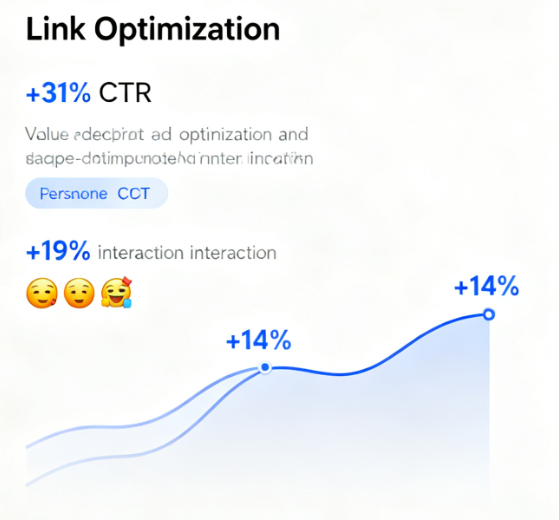
Link description optimization tests focused on action lead effectiveness. Comparison of functional and value descriptions shows that descriptions that emphasize value have a 31% higher click-through rate, and the call-to-action test finds that the use of first-person expressions boosts the interaction rate by 19%. Appropriate use of emoticons resulted in 141 TP3T higher click-through rates.
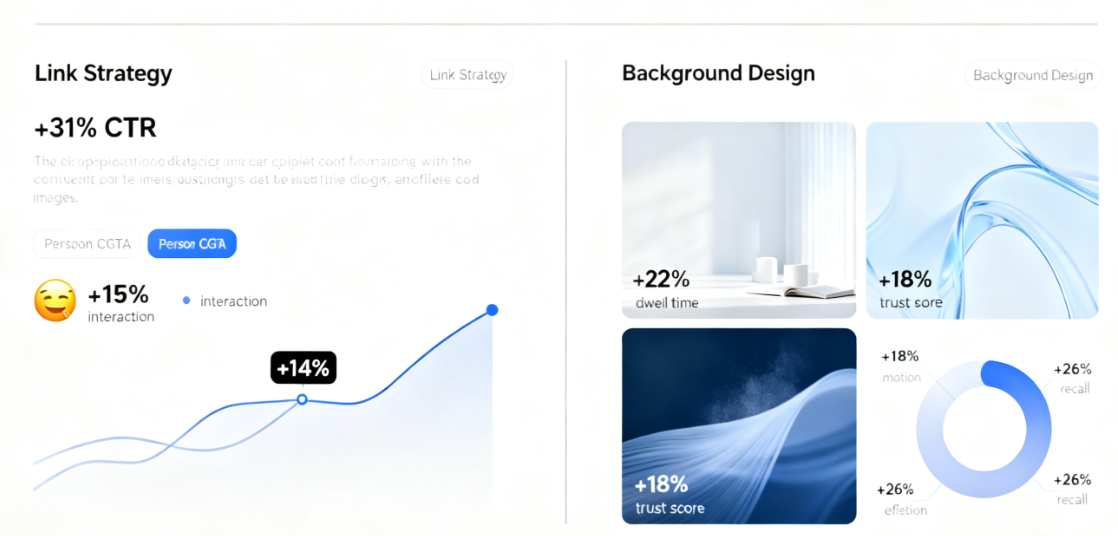
Background design tests examined the impact of the visual environment. Comparison of solid color backgrounds with picture backgrounds showed that relevant scene pictures boosted dwell time by 221 TP3 T. Color psychology experiments showed that cooler backgrounds had higher trust scores by 181 TP3 T. Dynamic effects tests found that moderate kinetic effects boosted memory by 261 TP3 T.
III. Data Optimization Practical Case Library
Actual cases provide the best evidence for theory, and these experiences from practice have direct reference value.
Fashion brand case study demonstrating the effects of link sorting optimization. By analyzing the click distribution data, the brand found that the clicks on the new product preview link were 3.2 times higher than those on the promotional link. Adjusting the link order to put the new product at the top increased the overall click-through rate from 19% to 28%. Ongoing monitoring data shows that this kind of ordering based on user interest maximizes the value of the page.
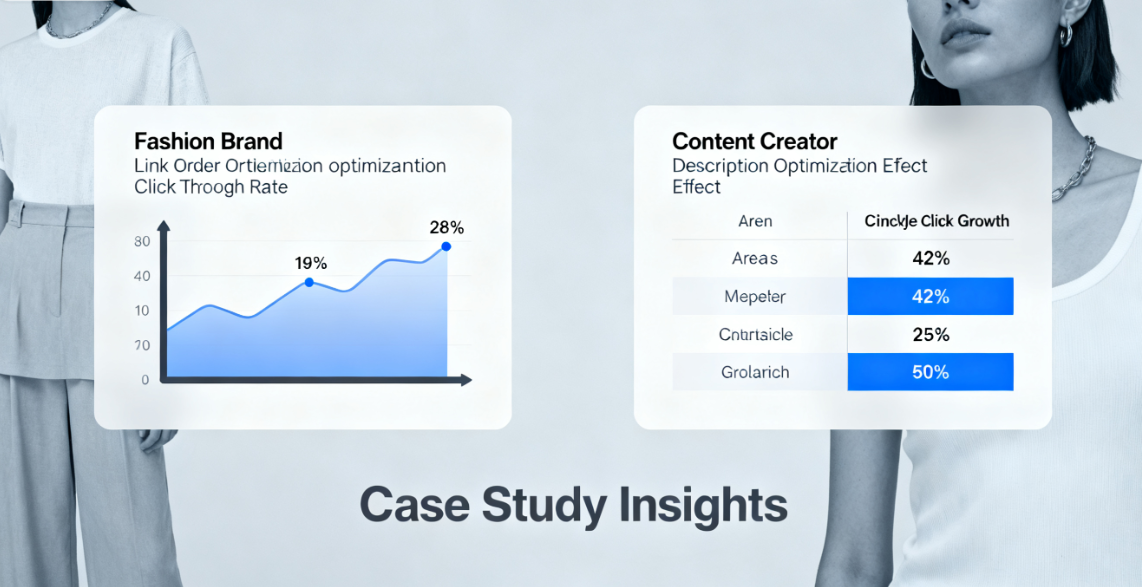
Content Creator Case Exemplifying the Power of Description Optimization. A knowledge blogger tested three link description styles: direct description, value promise, and curiosity piquing. The data showed that the value promise style had the highest click-through rate of 341 TP3T, and after standardizing on this description style, the average monthly click-through rate increased by 421 TP3T. this case shows the significant impact of accurate descriptions on conversion rates.
Enterprise services case study demonstrates the value of personalized testing. By using customized versions of Linktree across channels, the business found that visitors from LinkedIn were most interested in the case study, while Instagram-sourced users were more interested in the team presentation. After targeting page content across channels, overall conversion rates increased by 39%.
IV. Continuous optimization of workflow
Establish a systematic optimization process to ensure the continuity and effectiveness of improvement efforts.
The data monitoring phase requires the establishment of a routine checking mechanism. Daily attention is paid to fluctuations in core indicators, weekly in-depth data analyses are conducted, and monthly comprehensive effect reports are produced. This monitoring system ensures that problems are identified in a timely manner and responded to quickly.
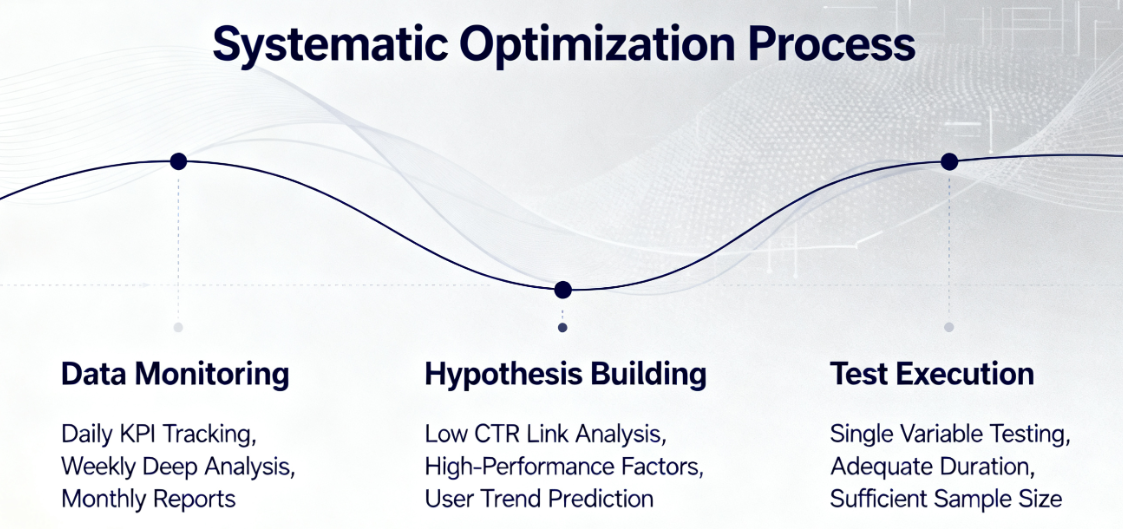
The hypothesis building phase proposes directions for improvement based on data insights. It analyzes the presence of low click-through links, examines the success factors of high-performing elements, and predicts trends in user behavior. These hypotheses provide clear goals for subsequent testing.
The test execution phase follows the scientific experimental method. Ensure that each test changes only a single variable, set a reasonable test duration, and collect sufficient data samples to support decision-making. Rigorous testing methodology ensures the credibility of the results.
V. Application of advanced analytical techniques
An approach that goes beyond basic analytics to provide new growth drivers for optimization.
Crowd segmentation analysis reveals behavioral differences between different user groups. Click patterns of new vs. returning visitors, preference analysis of users from different geographic sources, and differences in experience by device type. These insights support precise on-page optimization.
Time series analysis uncovers cyclical patterns in user behavior. Fluctuations in activity on weekdays and weekends, trends in seasonal demand, and special patterns during holidays. These findings provide time dimension reference for content strategy adjustment.
Predictive model building supports forward-looking optimization. Predicting content heat based on historical data, laying out in advance based on trend changes, and using machine learning algorithms to identify potential optimization points. These technical applications upgrade optimization from reactive to predictive.
By systematically applying data analytics, Linktree pages can be upgraded from simple link aggregation tools to efficient digital marketing hubs. This transformation requires rigor, scientific methodology and continuous investment, but the rewards are reflected in significantly higher conversion rates and more accurate marketing decisions.

Link to this article:https://www.361sale.com/en/80800/The article is copyrighted and must be reproduced with attribution.


![Emoji[wozuimei]-Photonflux.com | Professional WordPress repair service, worldwide, rapid response](https://www.361sale.com/wp-content/themes/zibll/img/smilies/wozuimei.gif)
![Emoticon[baoquan] - Photon Wave Network | Professional WordPress Repair Services, Worldwide Coverage, Rapid Response](https://www.361sale.com/wp-content/themes/zibll/img/smilies/baoquan.gif)


No comments