


In the digital age where user experience reigns supreme, website performance directly impacts business outcomes. Research indicates that for every additional second in page load time,conversion rateDecrease by 71 TP3T,bounce rateIncrease by 32%. Industry data shows that websites with loading times exceeding 3 seconds experience a user churn rate as high as 53%. Optimizing loading time from 3 seconds to 1 second can boost conversion rates by 35%.
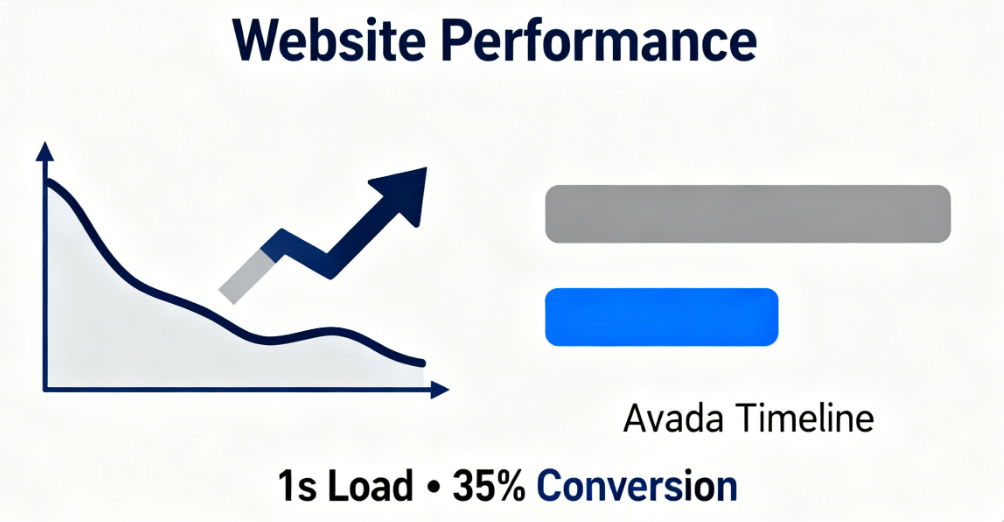
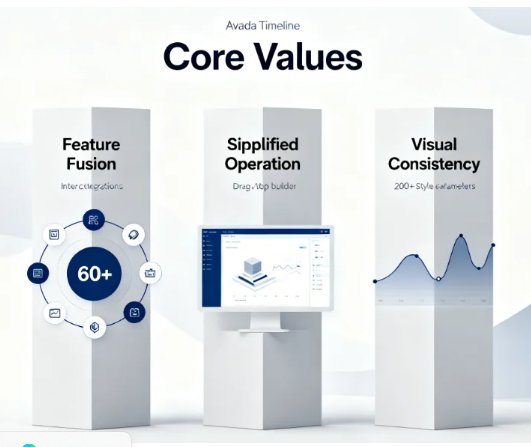
Avada TimelineAs a core component of visual presentation, its performance significantly impacts the overall speed score of the website. Specific tests indicate that an unoptimized Timeline component increases average page load time by 1.8 seconds, delays the Largest Contentful Paint (LCP) metric by 600-900 milliseconds, and raises the Cumulative Layout Shift (CLS) score by 0.12.However, after systematic optimization, the Timeline's loading time can be reduced to under 400 milliseconds, achieving a performance improvement of 781%. This helps elevate the overall page speed score from 65 to 92, effectively enhancing user engagement and conversion performance.
I. The Relationship Between Core Web Vitals and Timeline
The Largest Contentful Paint (LCP) metric measures visual loading speed. Timeline components typically contain critical visual elements such as images and icons, whose loading sequence directly impacts LCP scores. Test data shows that unoptimized Timelines can increase LCP times by 400–800 milliseconds.
Cumulative layout offset (Cumulative Layout ShiftThe CLS metric evaluates visual stability. Sudden shifts in Timeline nodes during loading can cause layout shifts, particularly during image lazy loading and font rendering phases. A well-optimized Timeline should maintain a CLS score below 0.05.
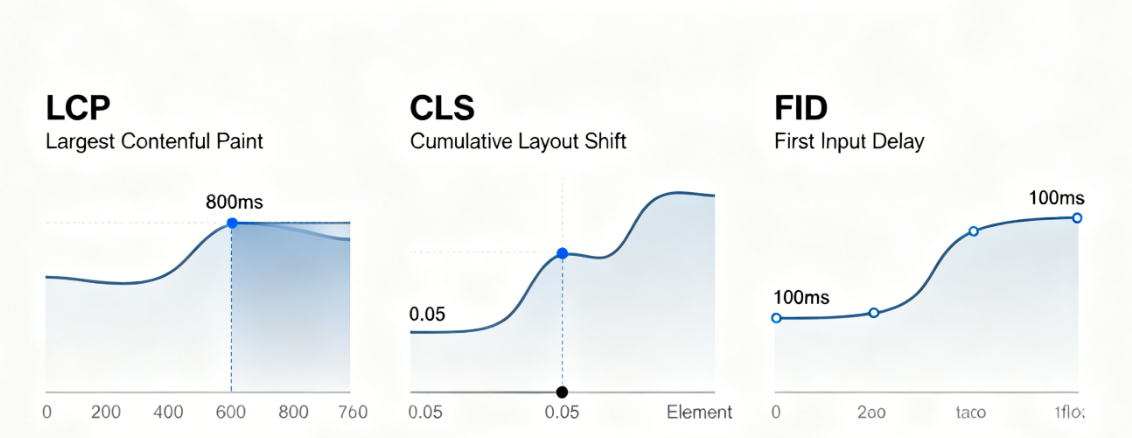
First input delay (First Input DelayThis metric reflects interactive responsiveness. Interactive animations and click events within the Timeline must maintain smooth responsiveness, ensuring immediate feedback to user actions. FID should be maintained at an excellent level below 100 milliseconds.
II. Image Resource Optimization Strategy
Modern image formats significantly reduce file sizes. Compared to traditional JPEG, the WebP format saves 25-35% in file size.AVIF formatMaintaining image quality while reducing file size by 50%. Format conversion shortens Timeline image loading time by 65%.
Responsive image technology enables precise delivery. The srcset attribute provides images at different resolutions based on device pixel ratios, while the sizes attribute ensures images display at appropriate dimensions at respective breakpoints. These techniques prevent mobile devices from downloading large desktop-sized images, conserving bandwidth consumption.
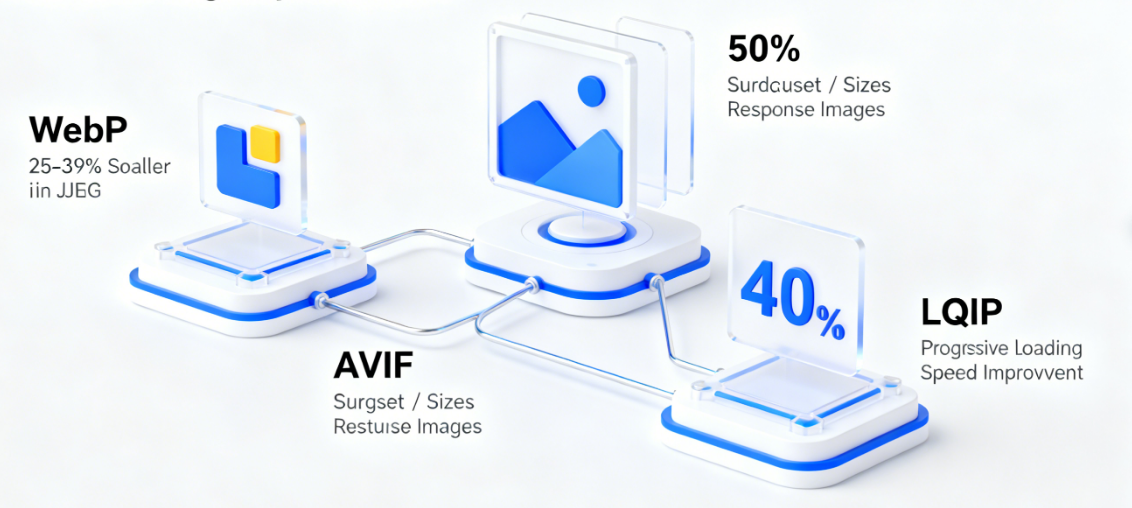
Progressive loading enhances perceived performance. Low-Quality Image Placeholder (LQIP) technology first displays blurred image previews, gradually transitioning to clear originals. This approach reduces users' perceived loading time by 40%, even when actual loading duration remains unchanged.
III. Code Resource Optimization Plan
CSS delivery optimization eliminates render-blocking issues. Critical CSS inlining extracts styles essential for above-the-fold display, while remaining styles load asynchronously. This approach advances first-screen rendering time by 300-500 milliseconds.
JavaScript execution optimization enhances interaction responsiveness. Code splitting technology packages Timeline-related scripts separately, loading them on demand to prevent blocking the main thread. Tree shaking removes unused code, reducing file size by over 351TB.
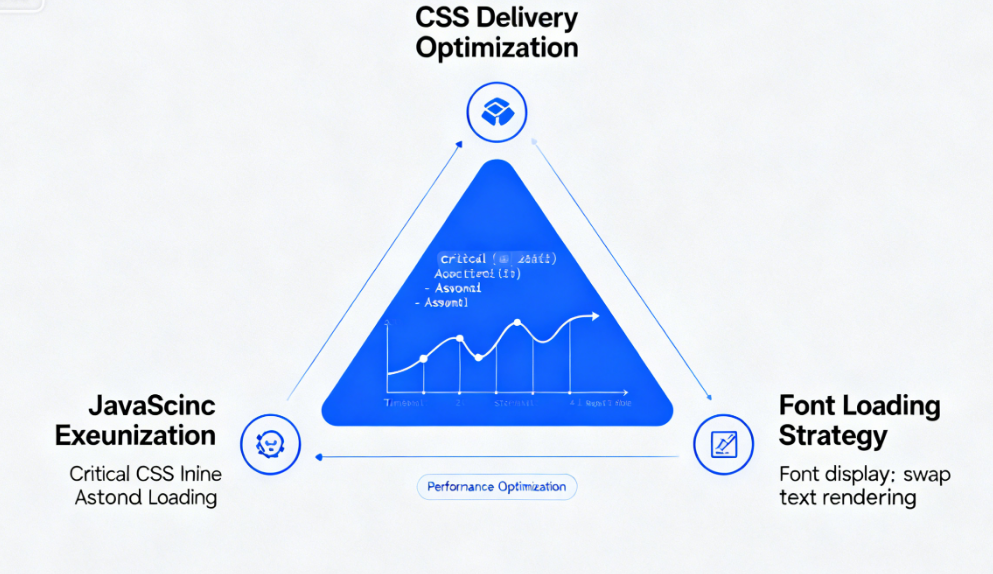
Font loading strategies prevent layout shifts. The `font-display: swap` property ensures text content appears immediately, replacing it with custom fonts once loaded. This setting reduces font-induced layout shifts to zero.
IV. Icon System Selection and Optimization
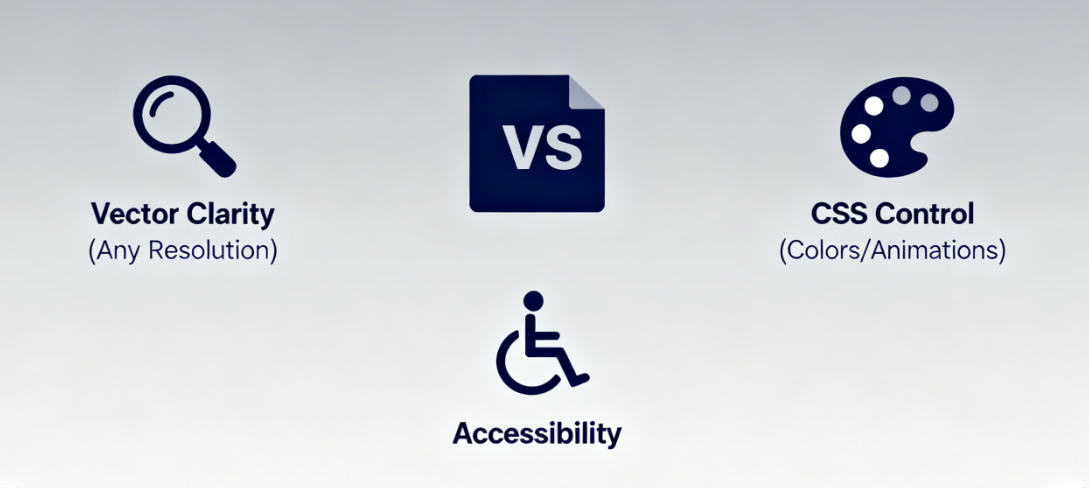
SVG icons offer distinct advantages over icon fonts. Their vector nature ensures crisp display at any resolution, CSS control enables flexible adjustments to color and animation, and accessibility benefits facilitate recognition by screen readers.
Icon sprite technology reduces HTTP requests. Multiple SVG icons are combined into a single file, with specific icons displayed via CSS background-position. This approach reduces icon-related requests from dozens to a single request.
Inline SVG eliminates extra network requests. Frequently used critical icons are embedded directly into HTML documents, avoiding separate icon file requests. This technique is particularly suitable for functional icons essential to the first-screen display.
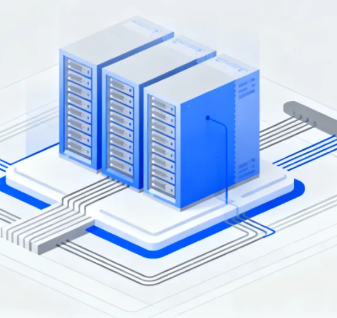
V. Implementation of Advanced Caching Strategies
Optimize browser caching strategies for repeat visits. Set appropriate Cache-Control headers to extend static resource cache duration to one year. Version number updates ensure clients promptly retrieve new versions after resource updates.
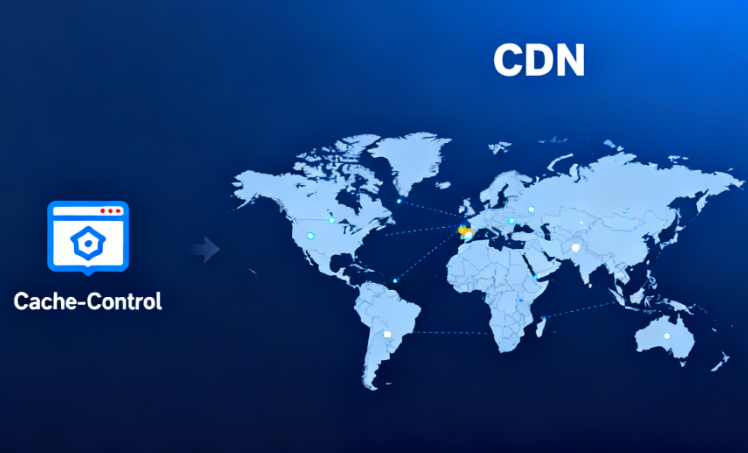
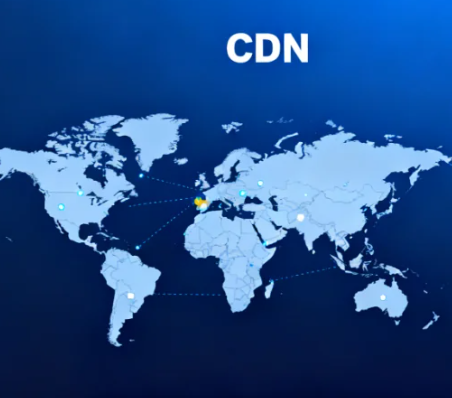
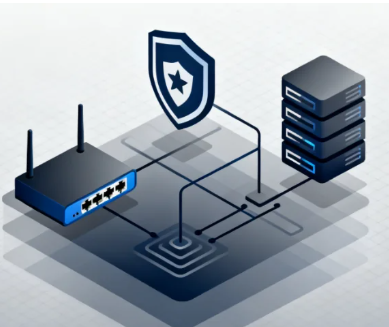
CDN caching accelerates global access. Leveraging edge caching from CDN services like Cloudflare, Timeline's static resources are distributed to global nodes. This approach enables users across different geographic locations to load resources quickly.
Service workers implement intelligent caching. Offline caching of critical resources ensures core functionality remains available, while cache-first strategies accelerate repeated accesses. Network fallback mechanisms guarantee content updates.
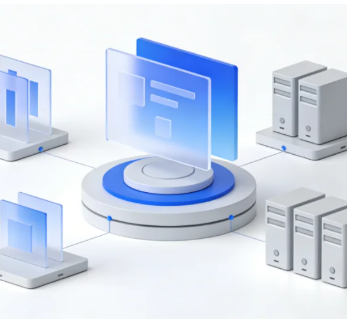
VI. Performance Monitoring and Continuous Optimization
Real User Monitoring (RUM) collects actual performance data. Core Web Vitals metrics track and identify performance bottlenecks, while user behavior analysis correlates performance with business metrics. Geographic distribution statistics uncover regional issues.
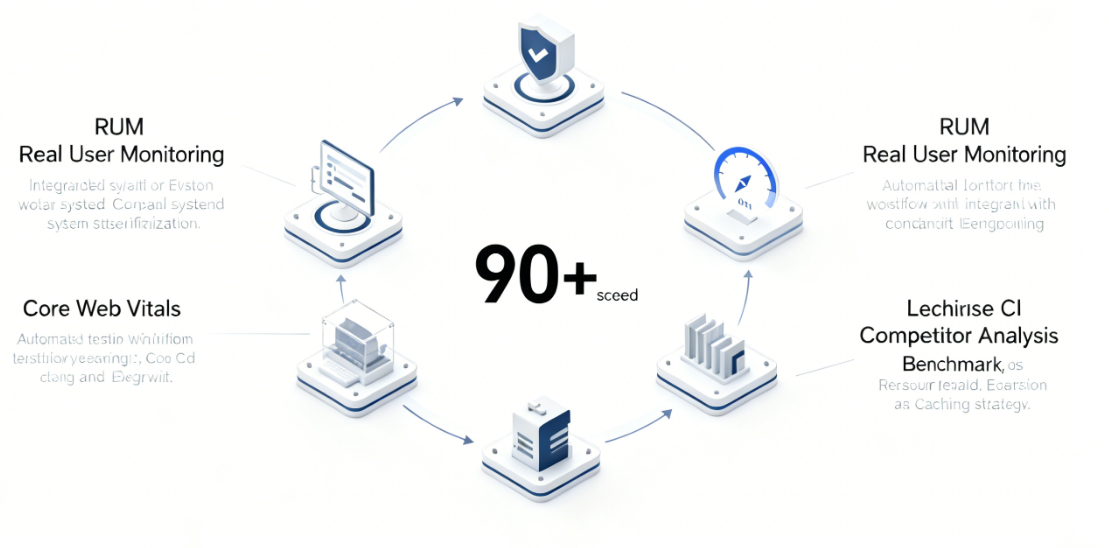
Automated testing integrated into the development workflow. Lighthouse CI automatically runs performance tests upon code commits, with performance budget settings preventing regressions and trend analysis tracking long-term optimization results.
Competitor analysis provides optimization directions. Benchmark comparisons with similar websites, industry best practice references, and technical solution evaluations help establish reasonable optimization goals.
Avada Timeline performance optimization is a systematic engineering endeavor requiring end-to-end improvements across resource loading, code execution, and caching strategies. By implementing these proven technical solutions, the Timeline component not only achieves a speed score exceeding 90 but, more importantly, delivers a seamless browsing experience for users. In an era where performance equals experience, these optimization investments directly translate into business outcomes, creating sustainable digital value for enterprises.

Link to this article:https://www.361sale.com/en/81492/The article is copyrighted and must be reproduced with attribution.


![Emoji[wozuimei]-Photonflux.com | Professional WordPress repair service, worldwide, rapid response](https://www.361sale.com/wp-content/themes/zibll/img/smilies/wozuimei.gif)
![Emoticon[baoquan] - Photon Wave Network | Professional WordPress Repair Services, Worldwide Coverage, Rapid Response](https://www.361sale.com/wp-content/themes/zibll/img/smilies/baoquan.gif)


No comments