


Loop Grid performance issues typically stem not from a single point of failure, but from a combination of factors: slow queries, heavy image loads, cache misses, and high front-end rendering pressure. Below is a breakdown: Query / Image / Cache / Frontend Rendering Four lines written, each one tells you where WordPress,ElementorWhere exactly do I look in the browser?
![Image[1] - Loop Grid Lagging? Troubleshooting Guide for Queries, Images, Cache, and Rendering](https://www.361sale.com/wp-content/uploads/2025/12/20251225152246674-img_v3_02ta_d49a257e-ebff-4ead-b362-fba3b860d16g.jpg)
1) First determine: Is the slowdown occurring on the backend or frontend (where to check)?
1.1 Inbrowser (software)Check TTFB (to determine if the backend is slow)
Location:Chrome → Press F12 → Network
Operation:
- tick Disable cache(For testing purposes only)
- Refresh Page (Ctrl+R)
- Tap the top one Document Request(Typically Doc / HTML)
![Image[2] - Loop Grid Lagging? Troubleshooting Guide for Queries, Images, Cache, and Rendering](https://www.361sale.com/wp-content/uploads/2025/12/20251225143430252-image.png)
- Click the document name to view it on the right. Timing(Timing)
![Image[3] - Loop Grid Lagging? Troubleshooting Guide for Queries, Images, Cache, and Rendering](https://www.361sale.com/wp-content/uploads/2025/12/20251225143525926-image.png)
How to view:
- Waiting (Time to First Byte) Very long: Backend slow (queries/caching/PHP)
- TTFB isn't long, but page scrolling lags: Heavy front-end rendering load
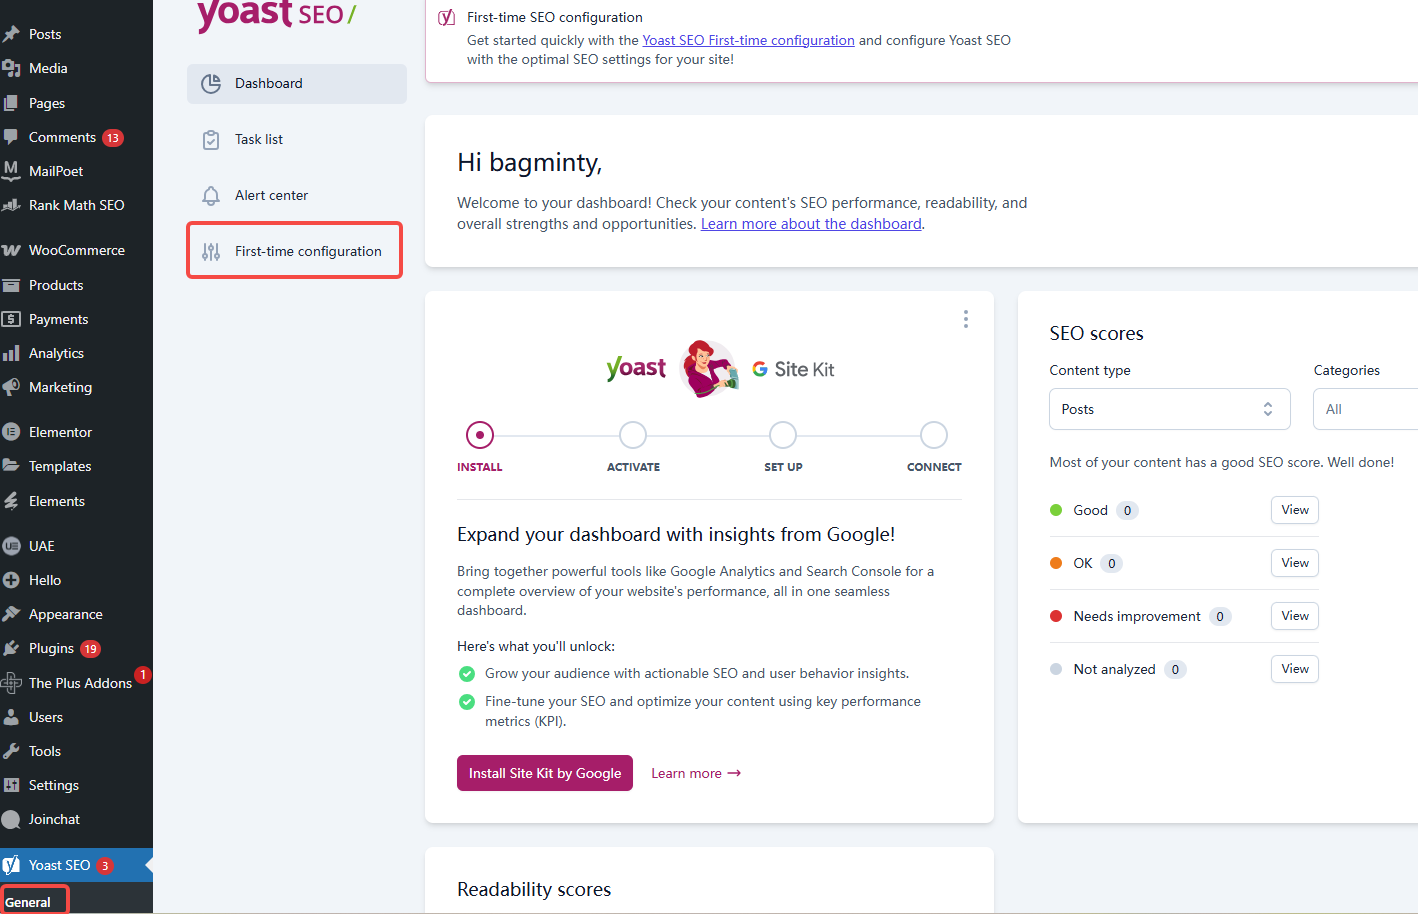
2) Query (Loop Grid (Data Retrieval): Where can I view "Items per Page" and "Query Settings"?
2.1 Viewing How Many Items Are Displayed Per Page in Elementor
Location:Edit this page → Click the Loop Grid widget → Left panel Content
Common entry names (may vary slightly across versions):
- Content → Layout(Layout)
- Posts Per Page / Items Per Page / Display per page(Number of items)
![Image[4] - Loop Grid Lagging? Troubleshooting Guide for Queries, Images, Cache, and Rendering](https://www.361sale.com/wp-content/uploads/2025/12/20251225144455670-image.png)
The tests you need to take:
- Change the number of items per page from 24 to 12, then to 8, and compare whether it speeds up.
2.2 In Elementor Query Types and Filter Conditions
Location:Loop Grid → Content → Query
Pay close attention to whether these items are set too high:
- Include / Exclude(include/exclude)
- Order By(Sorting: Popularity/Sales/Rating is typically slower)
- Source(Source: Article/Product/Article Category Type)
![Image[5] - Loop Grid Lagging? Troubleshooting Guide for Queries, Images, Cache, and Rendering](https://www.361sale.com/wp-content/uploads/2025/12/20251225145130721-image.png)
3) Images: Where can I view "the size of each image and the total size"?
3.1 Viewing Image Size in a Browser
Location:Chrome → F12 → Network → Filter by selecting Img
Operation:
- refresh page
- Click Img
- See the list Size(Size)
![Image[6] - Loop Grid Lagging? Troubleshooting Guide for Queries, Images, Cache, and Rendering](https://www.361sale.com/wp-content/uploads/2025/12/20251225145825928-image.png)
How to view:
- List Thumbnail Recommendations 50KB–150KBTry not to exceed 200KB
- If you see a lot of thumbnails at 300KB, 500KB, or 1MB, that's the main thing slowing things down.
3.2 In WordPress View Thumbnail Size Settings (Basic)
Location:Backend → Settings → Media
![Image[7] - Loop Grid Lagging? Troubleshooting Guide for Queries, Images, Cache, and Rendering](https://www.361sale.com/wp-content/uploads/2025/12/20251225150027906-image.png)
You can confirm:
- Are the thumbnail dimensions set appropriately (not too large)?
- However, note that Elementor/themes may also use their own size rules.
![Image[8] - Loop Grid Lagging? Troubleshooting Guide for Queries, Images, Cache, and Rendering](https://www.361sale.com/wp-content/uploads/2025/12/20251225150048543-image.png)
4)(computing) cacheWhere can I check whether a cache hit occurred or if it was bypassed?
4.1 Check Cache Effectiveness Using Incognito Mode (Simplest Method)
Location:Chrome → Three dots in the top-right corner → New Incognito Window
Operation:
- Open the same page in incognito mode and compare speeds.
How to view: - Invisible mode is noticeably faster: Your logged-in state may bypass caching, or caching rules differ for logged-in users.
![Image[9] - Loop Grid Lagging? Troubleshooting Guide for Queries, Images, Cache, and Rendering](https://www.361sale.com/wp-content/uploads/2025/12/20251225150152454-image.png)
4.2 Checking Cache/CDN Hits in the Browser (Advanced)
Location:Chrome → F12 → Network → Click Doc/HTML → Response Headers
![Image[10] - Loop Grid Lagging? Troubleshooting Guide for Queries, Images, Cache, and Rendering](https://www.361sale.com/wp-content/uploads/2025/12/20251225150520648-image.png)
You may see similar fields (varies by server):
cf-cache-status(Cloudflare Common: HIT/MISS)x-cache,cache-controlet al. (and other authors)
How to view:
- With HIT, it's more stable.
- Consistently returning MISS indicates cache misses or rules being bypassed (e.g., due to parameters or high dynamic content on the page).
5)forward part of sth.Rendering: Where to check for "frame drops during scrolling and rendering performance"
5.1 Performance When Viewing Scrolling in the Browser
Location:Chrome → F12 → Performance
Operation:
- Click Record
- Scroll the page for 3–5 seconds
- Stop recording
![Image[11] - Loop Grid Lagging? Troubleshooting Guide for Queries, Images, Cache, and Rendering](https://www.361sale.com/wp-content/uploads/2025/12/20251225150947618-image.png)
How to view:
- Rendering/Painting High: Too many shadows, filters, animations, and DOM elements
- Scripting Very high: JavaScript is too heavy (typically due to excessive animations and script loading)
6) Follow this sequence for the fastest troubleshooting.
- browser (software) Network View TTFB(Confirm backend/frontend)
- Elementor puts Halve the number of items per page Make a comparison
- Network Filter Image View Image Size
- Split-Screen Comparison Cache Hit Difference
- Performance recording scroll, watch Is Rendering Off the Charts?
wind up
Complete them in order Time to First Byte → Items per Page → Image Size → Cache Hit Rate → Scrolling PerformanceOnce you identify the bottleneck, focus solely on optimizing the slowest component in the next step:
- High Time to First ByteStreamline queries and reduce the number of items per page.
- Large ImageUnify thumbnail dimensions and compress
- Scroll card:Turn off animations, reduce shadows, minimize fields
After making changes, perform two incognito refreshes and retest: TTFB and Finish times show significant improvement, so the issue is resolved.

Link to this article:https://www.361sale.com/en/84292The article is copyrighted and must be reproduced with attribution.


![Emoji[wozuimei]-Photonflux.com | Professional WordPress repair service, worldwide, rapid response](https://www.361sale.com/wp-content/themes/zibll/img/smilies/wozuimei.gif)
![Emoticon[baoquan] - Photon Wave Network | Professional WordPress Repair Services, Worldwide Coverage, Rapid Response](https://www.361sale.com/wp-content/themes/zibll/img/smilies/baoquan.gif)


No comments