


Have you ever encountered a website that fails to load, or suddenly pops up while browsing "502 Bad Gateway"or"504 Gateway Timeout"Error message? These errors not only affect the user experience, but can also lead to a drop in site visits and in serious cases, even affect the operation and reputation of the site. Are you wondering how to quickly locate the source of these errors? Especially in the case of complex system architecture, how to quickly find the problem through the browser console?
![Image [1] - How to locate the source of 502 and 504 errors through the browser](https://www.361sale.com/wp-content/uploads/2025/10/20251024155322740-image.png)
These common HTTP errors can be caused by a variety of reasons, such as server timeouts, network connectivity issues, or load balancing configuration problems. By means of thebrowser console, you can quickly locate the source of the error. In this article, we will introduce how to debug using the console and web panel to help you efficiently resolve 502 & 504 errors and ensure smooth operation of your website.
What are 502 and 504 errors?
Before we start debugging, let's first briefly review the 502 and 504 errorsMeaning of:
- 502 Bad Gateway: Usually means that the server acting as a gateway or proxy is not getting a valid response from the upstream server. It is usually caused by the upstream server being down, unresponsive, or unable to process the request.
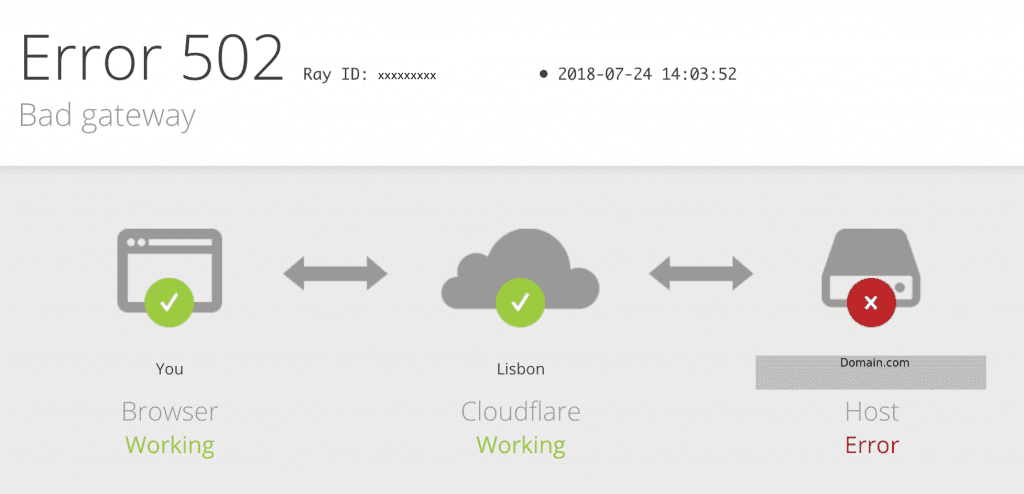
- 504 Gateway Timeout: Indicates that the requesting gateway or proxy server timed out while waiting for a response from the upstream server, usually because the upstream server responded too slowly or the requested data could not be processed in time.
While both errors are related to communication problems between servers, their causes and effects can vary.
Debugging 502 and 504 Errors Using the Browser Console
Modern browsers offer powerful developer tools, with the consoles respond in singing network panel are important tools for locating 502 and 504 errors. The following section describes how to utilize these tools for debugging.
1. Open your browser's developer tools
First, open the browser developer tools (DevTools). In most browsers, you can open it in the following way:
- Google Chrome: Right-click on a blank space on the page → "Inspect", or press the
Ctrl + Shift + I(Windows)/Cmd + Option + I(Mac).
![Image [3] - How to locate the source of 502 and 504 errors through the browser](https://www.361sale.com/wp-content/uploads/2025/10/20251024160026109-image.png)
- Firefox: Right-click on a blank space on the page → "Inspect Element", or press the
Ctrl + Shift + I(Windows)/Cmd + Option + I(Mac). - Safari: Press
Cmd + Option + Ior via the "Developer" option in the Safari menu.
2. Viewing console output
The Console panel provides information about page runtime errors.502 and 504 ErrorThis is where it usually comes up, especially if the error occurs at the JavaScript level.
How to view the console log:
- Switch to consoles tab (Console tab) to view detailed error logs.
![Image [4] - How to locate the source of 502 and 504 errors through the browser](https://www.361sale.com/wp-content/uploads/2025/10/20251024160156328-image.png)
- Errors will be displayed in red and will usually contain the status code of the error (e.g. 502 or 504), and may also show more information about the request, such as the URL, timestamp, etc.
- You can see if there are any other related JavaScript errors or warnings that may be affecting the API request, which in turn may cause the gateway to time out or fail to get a valid response.
Debugging Tips:
- ferret out error message: If the console displays detailed error information (e.g., the URL of the request, response time, request headers, etc.), you can use this information to find the specific part of the error.
- ferret out network request: If there is API When a request fails, the console error log will often provide the URL and status code of the request. This helps you identify where the request went wrong (whether it was a timeout on the request port, or a problem with the returned data).
3. Using the web panel to analyze requests
network panel(The Network panel is the central tool for debugging 502 and 504 errors. The network panel allows you to view all outgoing requests and their responses, and to see exactly which requests failed.
How to use web panel analysis:
- show (a ticket) reticulation(Network) panel, refresh the page and observe all HTTP requests.
![Image [5] - How to locate the source of 502 and 504 errors through the browser](https://www.361sale.com/wp-content/uploads/2025/10/20251024160722496-image.png)
- filtering request: You can filter by request type, in particular XHR(XMLHttpRequest) and the Fetch requests, usually these are API requests.
![Image [6] - How to locate the source of 502 and 504 errors through the browser](https://www.361sale.com/wp-content/uploads/2025/10/20251024160642708-image.png)
- locateFailed requests: In the Network panel, you can see the status code of the request. If there is a 502 or 504 error, click on the request to see detailed request and response information.
Analyze failed requests:
- Status code of the request: Next to Failed Requests, look for the HTTP status code. If it's 502 or 504, click on the request to see its response header respond in singing request header, which helps to understand what the problem is.
- Request Response Time: In the Network panel, you can view the response time for each request. If the response time is very long, the upstream server may be taking too long to process the request, resulting in a 504 error.
- Timeout settings for requests: Checks the timeout setting for a request. If the response time exceeds the set timeout value, a 504 error is triggered.
4. Checking the response of upstream servers
If it is 502 Error, you can further analyze the upstream server for problems. In the browser console, you will usually see the details of the request failure, as shown below:
- Server not responding: A 502 error occurs if the server that is the target of the request is unable to respond. This may be due to server downtime, network failure, or server configuration problems. You can see the error message in the consoleFind the destination server for the request, check if you can access the server normally.
![Image [7] - How to locate the source of 502 and 504 errors through the browser](https://www.361sale.com/wp-content/uploads/2025/10/20251024162358567-image.png)
- Proxy Configuration Issues: If you are using a proxy server or load balancer, a misconfiguration may result in a 502 error. Check the configuration of the proxy server to ensure that it is able to forward requests correctly.
5. Viewing API requests and third-party services
If your site relies on an external API service, the 502 and 504 errors are most likely due to the External API Services of the issue. You can see the details of the external request through the web panel.
- Checking the status of external services: If your application relies on an external service, make sure that the service has not failed. You can check the status page of the external API or analyze the logs to see if there are any timeouts or server failures.
- Service availability: View request header respond in singing response headerIf the external API service returns a valid response, or if there are network delays or failures, then you can see if the external API service returns a valid response.
![Image [8] - How to locate the source of 502 and 504 errors through the browser](https://www.361sale.com/wp-content/uploads/2025/10/20251024161514432-image.png)
6. Adjustment of timeout settings for requests
If you find that the 504 error is due to the request's timeout, try adjusting the request's timeout setting.
- Increase timeout: If network latency or response times are long, increasing the timeout for requests appropriately can help minimize the occurrence of 504 errors.
- Optimize back-end performance: If the back-end service response is too slow, consider optimizing the service performance to reduce the processing time of the request.
summarize
502 and 504 errorsAlthough they are common HTTP error status codes, we can effectively troubleshoot and debug them through the developer tools provided in the browser console. Through the web panel and console logs, we are able to locate the source of the error and identify problems with upstream servers, proxy configurations, API requests, and more. For developers, mastering these debugging skills not only solves problems faster, but also improves the stability of the site and user experience.

Link to this article:https://www.361sale.com/en/79139/The article is copyrighted and must be reproduced with attribution.


![Emoji[wozuimei]-Photonflux.com | Professional WordPress repair service, worldwide, rapid response](https://www.361sale.com/wp-content/themes/zibll/img/smilies/wozuimei.gif)
![Emoticon[baoquan] - Photon Wave Network | Professional WordPress Repair Services, Worldwide Coverage, Rapid Response](https://www.361sale.com/wp-content/themes/zibll/img/smilies/baoquan.gif)


No comments